


Data is everywhere, but many businesses struggle to turn it into something useful. Marketing analytics helps make sense of that data by showing you what’s working and what’s not.
But, even though marketing analytics is 23 times more effective at acquiring customers, only 53% of companies use it to guide their decisions.

This gives you a clear advantage.
By turning data into actionable insights, you can create marketing magic that improves your marketing campaigns and boosts conversion rates.
Also, marketing analytics shouldn’t be just restricted to companies with enormous amounts of data.
In this article, we’ll show you how to use marketing analytics to turn data into insights without needing complex math, programming, or a team of data analysts.
But first, what exactly is marketing analytics?
What Are Marketing Analytics
Marketing analytics is the process of using data to understand how well your marketing efforts are working. It lets you see the whole picture. It takes all the data from your campaigns and helps you figure out what's working and what's not.
This data is collected from various sources, such as:
- Surveys and customer feedback (response rate, satisfaction scores, net promoter score)
- Social media platforms (likes, shares, profile visits, post interactions)
- Email campaigns (open rates, click-through rates, conversion rates)
- Online ads (impressions, clicks, cost per acquisition)
- Your website (bounce rate, average time on site)
While these metrics might seem complex at first, they are easier to understand than you think.
Let’s take the real-life example of EasyJet.
EasyJet celebrated its 20th anniversary with a personalized email campaign that used customers' travel histories to create engaging email stories. This approach led to open rates over 100% higher than their average newsletter and a 25% increase in click-through rates.

This shows how leveraging data-driven insights can enhance marketing effectiveness.
By analyzing more such insights, you can improve your marketing campaigns, reach more people, turn data into actionable insights, and ultimately sell more products or services.
Track your organic traffic, keyword positions and growth opportunities. Try it free.
Why Turning Data Into Insights Is Essential For Profitable Marketing?
"As a marketer, you are better off reaching 1,000 qualified leads than wasting resources on 10,000 who aren’t interested." - Vineet Gupta, Founder of 2xsas
When you use insights to figure out who is most likely to be interested in your product, you save both time and money by focusing your efforts where they matter.
Let’s understand this again with an example.
Imagine you provide a communication tool for remote teams. Without marketing analytics, you may send a generic email to businesses, hoping someone will sign up for a free trial or a demo.
With a proper marketing analytics in place, you can turn data into insights and focus on companies that have actually shown interest in your product. This includes people who visited your pricing page, docs, or downloaded a productivity eBook.
This targeted approach increases the chances of a positive response.
Now, let’s see how you can gather the right data to make this happen effectively:
Collecting the Right Data
Getting decent data is often the first challenge of turning data into actionable insights.
Many marketers struggle with this because they’re unsure which metrics to track or how to gather meaningful insights.
For starters, we’ll focus on data that’s easy for you to gather, understand, and that can make a big impact on your campaigns:
1. Identifying Simple Key Metrics With High Returns
Start by focusing on key metrics like:
- Website traffic
- Conversion rates
- Customer demographics (age, gender, location, income etc.)
- Social media engagement
- ROI
Understanding these metrics reveals how effectively you’re reaching your audience.
You can start by tracking conversion rates for different landing pages.
If one page converts significantly better than others, it might indicate that its design, copy, or call-to-action is more effective.
Recognizing these nuances allows you to replicate that success across your other pages.
2. Use No-Code Tools To Collect Data Easily
You can use no-code tools like Google Analytics (GA4), Google Search Console (GSC), and StoryChief to collect, analyze and turn data into actionable insights.

GSC allows you to gather insights into your website's search performance. GA4, on the other hand, dives deeper into user behavior on your site. It tracks actions like:
- Page views: Track which pages users visit and how often.
- Conversions: Actions that indicate success, like form submissions or completed purchases.
- Engagement metrics: Monitor metrics like scroll depth and time spent on page.
- Click Tracking: Measure which links or buttons users click on to identify navigation patterns.
And more.
Similarly, StoryChief is particularly helpful for your content marketing funnels.
It helps you gather specific engagement metrics on your content (blog posts, social media posts, videos) across different platforms.
3. Identifying Pain Points In Your Marketing Strategy
Simple changes to your marketing strategy can go a long way. Here are some easy things you can do right now to instantly improve the quality of your content:
- Gather Feedback: Create simple and free surveys with SurveyMonkey or Google Forms to ask your customers, sales, and marketing team about their experiences. This provides direct insights on what to improve.
- Test different posting times: You can experiment with different posting times for your content. For example, many marketers find that publishing blogs at 9 AM leads to better CTRs.
- A/B Testing: You can try different subject lines or content in your emails to see what works best. The same can be done with content across all channels such as blog posts, videos, landing pages, and social media posts.
Finally, remember to update your content regularly. Fresh content keeps your audience engaged and helps improve your SEO.
By following these steps, you can better understand your marketing effectiveness and make smart changes to improve your strategy.
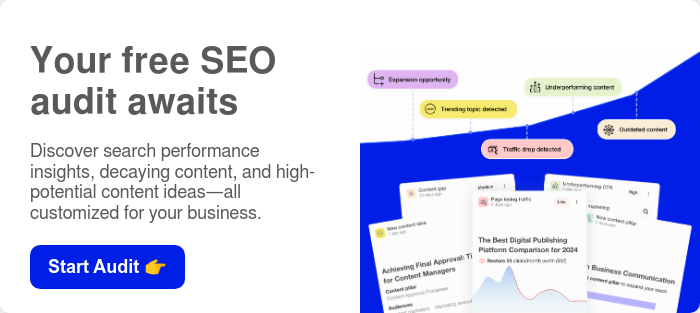
Optimize your content effortlessly with StoryChief’s free Content Audit. Instantly boost SEO, readability, and engagement with our automated tool—start seeing results today!

Turning Data Into Actionable Insights
Turning data into actionable insights means using your data to make specific, informed decisions that can improve your marketing efforts.
But what do these “insights” mean specifically?
What Are Insights?
Insights are the valuable pieces of information you gain from analyzing data. They help you understand trends, behaviors, and patterns in your audience or marketing performance. By turning these insights into actions, you can make informed decisions.
For example, here are some examples of actionable insights:
- Attendance for webinars drops significantly when scheduled during work hours.
- Emails with personalized subject lines have a 20% higher open rate than generic ones.
- A landing page for a free trial has a higher bounce rate. This means visitors leave before taking action.
- Posts featuring customer testimonials receive higher engagement compared to promotional posts.
- A specific demographic (e.g., ages 25-34) converts at a higher rate for certain profitable digital products.
- YouTuber merch stores see a notable increase in sales when you promote exclusive designs during live streams.
Now that we have these insights, the next step is to take action on them to improve your marketing strategies.
How To Turn Your Insights Into Meaningful Actions
“Data without action is just noise” - Ian Nicolls, Founder of AutomobilGarage.com
To turn your data into effective actions, consider the following steps:
- Set clear goals: Define what success for your marketing looks like. If your goal is to increase conversion rates, set a specific target, like raising it by 10% over the next quarter.
- Analyze trends: Look for patterns over time. Are certain pages getting more traffic during specific months? This can guide your content planning.
- Segment your audience: Break down your audience data by demographics, behavior, or preferences. This helps adjust your marketing strategies to different groups.
- Test and optimize: Use A/B testing to try different approaches. For instance, test two versions of an email subject line to see which one gets more opens.
To make the most of the insights shared earlier, here are clear actions you can take:

- Plan future webinars outside of typical work hours to boost attendance.
- Always use personalized subject lines in your email campaigns to increase open rates.
- Analyze the content and design of the landing page to reduce bounce rates.
- Create more posts featuring customer testimonials and success stories to enhance engagement on social media.
- Focus your marketing efforts on the 25-34 age group for products where they show higher conversion rates.
- Promote exclusive merch designs specifically during your live streams to turn your YouTube merchandise store into a success.
For an easy way to do a content audit, consider using tools like StoryChief and Google Analytics. StoryChief simplifies identifying content opportunities, while Google Analytics gives deeper insights into user behavior.

Applying Actionable Insights To Improve Marketing Campaigns
Data helps marketers explore fresh ideas by providing real-time feedback.
Marketing analytics gives you the ability to take insights from your data and apply them to try new ideas or strategies.
For example, if your data show that blog posts about industry trends drive significantly more traffic than other types of content, you could focus on creating a content series around current industry developments.
Once published, you could monitor how this content impacts your website traffic, time spent on the page, and conversion rates. Based on these insights, you can further refine your content strategy to focus more on industry-related topics.
By leveraging these insights, you can test new content themes and formats, using data to continuously optimize and improve your campaigns.
Measuring Results And Making Adjustments
Once you've applied data-driven insights and made changes to your campaigns, the next step is to track their impact.
Measuring results helps you understand what worked and what didn’t, so you can refine your strategy.
Here’s how you can track and refine:
- Monitor the specific metrics that relate to your campaign changes. For example, if you targeted a new demographic or adjusted your content, track changes in conversion rates, traffic, or engagement levels to see the direct impact.
- Use your analytics tool (such as GA4) to compare before-and-after data. Look at trends over time to get a clearer picture of performance.
- If a campaign didn’t perform as expected, don’t hesitate to modify your approach. Continuously adjust your content, targeting, or promotional strategies based on what the data tells you.
The key is to be flexible and use real-time information to shape your decisions.
By regularly measuring and making adjustments, you can create a feedback loop that ensures your marketing stays optimized for success.
Conclusion
Turning data into actionable insights is a game-changer for your marketing efforts.
This approach helps you focus on what truly matters — reaching the right audience and improving your campaigns.
You can use this data not just to inform decisions but to create impactful changes that drive results. With the right insights and actions, your marketing can truly shine!
Try StoryChief's free Content Audit. Discover gaps, enhance readability, and boost your SEO—all in just a few clicks. Start now and see measurable improvements in traffic, engagement, and conversion rates.
